Local governments, in an effort to move towards a more sustainable future, have invested in alternative modes of transportation and multi-modal mobility, with biking being at the center of these efforts. One of the barriers-to-entry for this mode of transportation is safety.
slowing down traffic by reducing speed limit and/or narrowing streets, coupled with bike lanes, can increase biking safety
Many cities—particularly in North America—are not designed for biking and they lack the infrastructure to keep cyclists safe. The COVID-19 pandemic has lowered this barrier a bit, since the so-called “covid boom” has turned people to biking as a form of transportation to avoid crowds or to get their daily exercise.
The reduced auto traffic during the pandemic also helps with their feeling of safety. What will happen though once we—hopefully—return to normal pre-COVID environment? Will people feel and be safe to keep riding their bikes?
In this work, we analyzed bike accident data from 3 fairly distinct cities (Pittsburgh, Boston and London) to understand what variables are associated with biking safety and identify any differences among different cities.

We examined several variables including speed limit, street width, distance to intersections, the presence of a bike lane, the topology of the street, the hilliness of the street, as well as network proxies for the traffic volume that goes through this street segment.
While the results of the analysis were not surprising in terms of the expected associations, they were surprising in the sense that the models built for the different cities were extremely similar. This is crucial since many local governments take a copy-cat approach to planning, and hence, street design for bike safety can be transferable among cities.
Specifically, our models indicate—among other observations—that wide and fast streets reduce biking safety, while the presence of dedicated bike lanes increases safety. Therefore, slowing down traffic by reducing speed limit and/or narrowing streets, coupled with bike lanes, can increase biking safety.
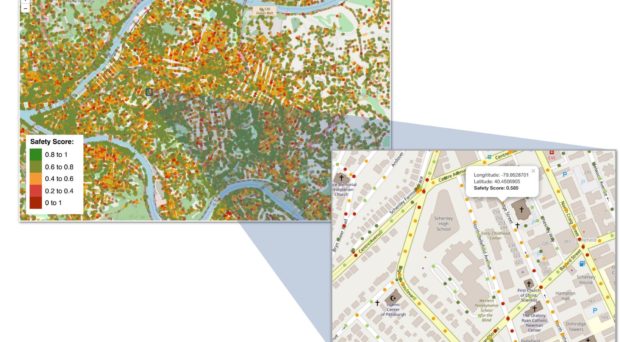
The models developed can allow us to also facilitate policy decisions with respect to infrastructure updates. For example, the figure at the top of this post shows a snapshot of an interactive map of results we obtained from our model for the city of Pittsburgh. By clicking on each point, users are able to obtain its safety score.
Low-risk locations are colored green, while risky locations are colored red. Using these results one can start identifying locations that are not as safe as needed and explore what infrastructure changes are going to have the maximum impact on biking safety, possibly under budgetary and policy constraints.

Obviously with cities today being cash strapped, they cannot just install bike lanes, or reconfigure the width of all the streets. However, our model can be used to make optimal decisions under these constraints.
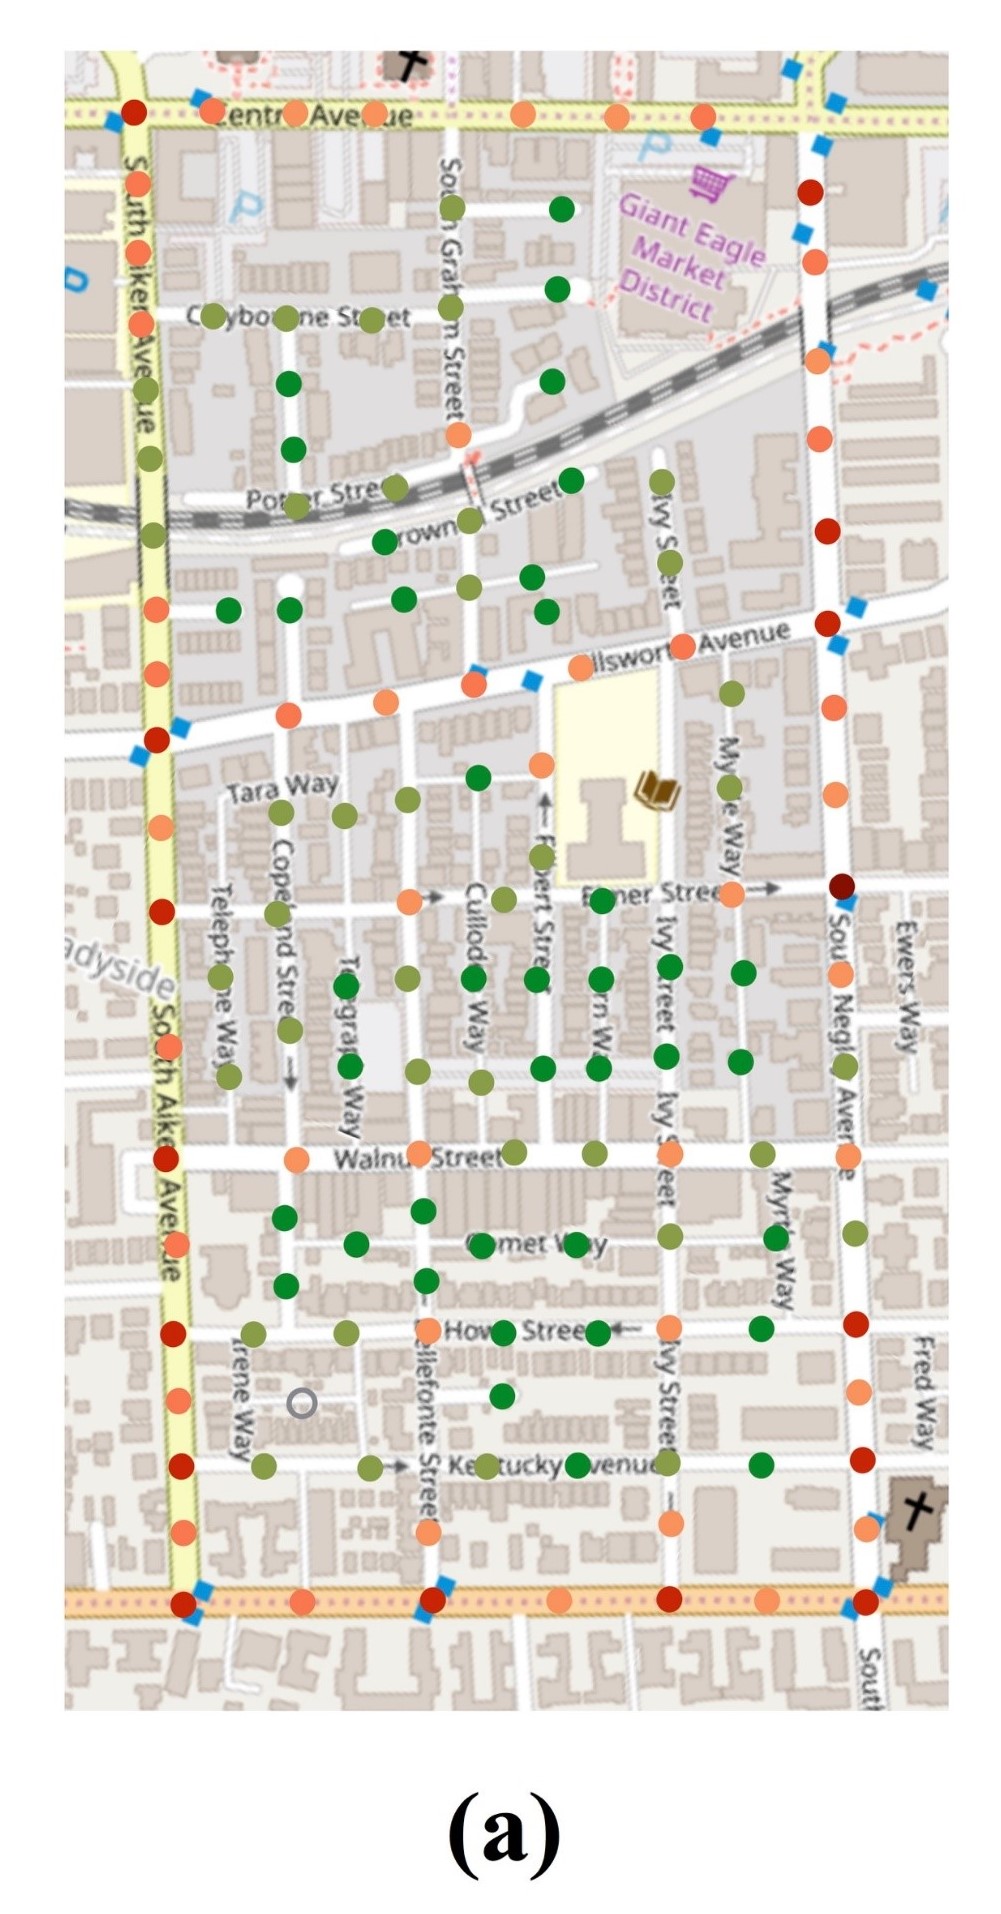
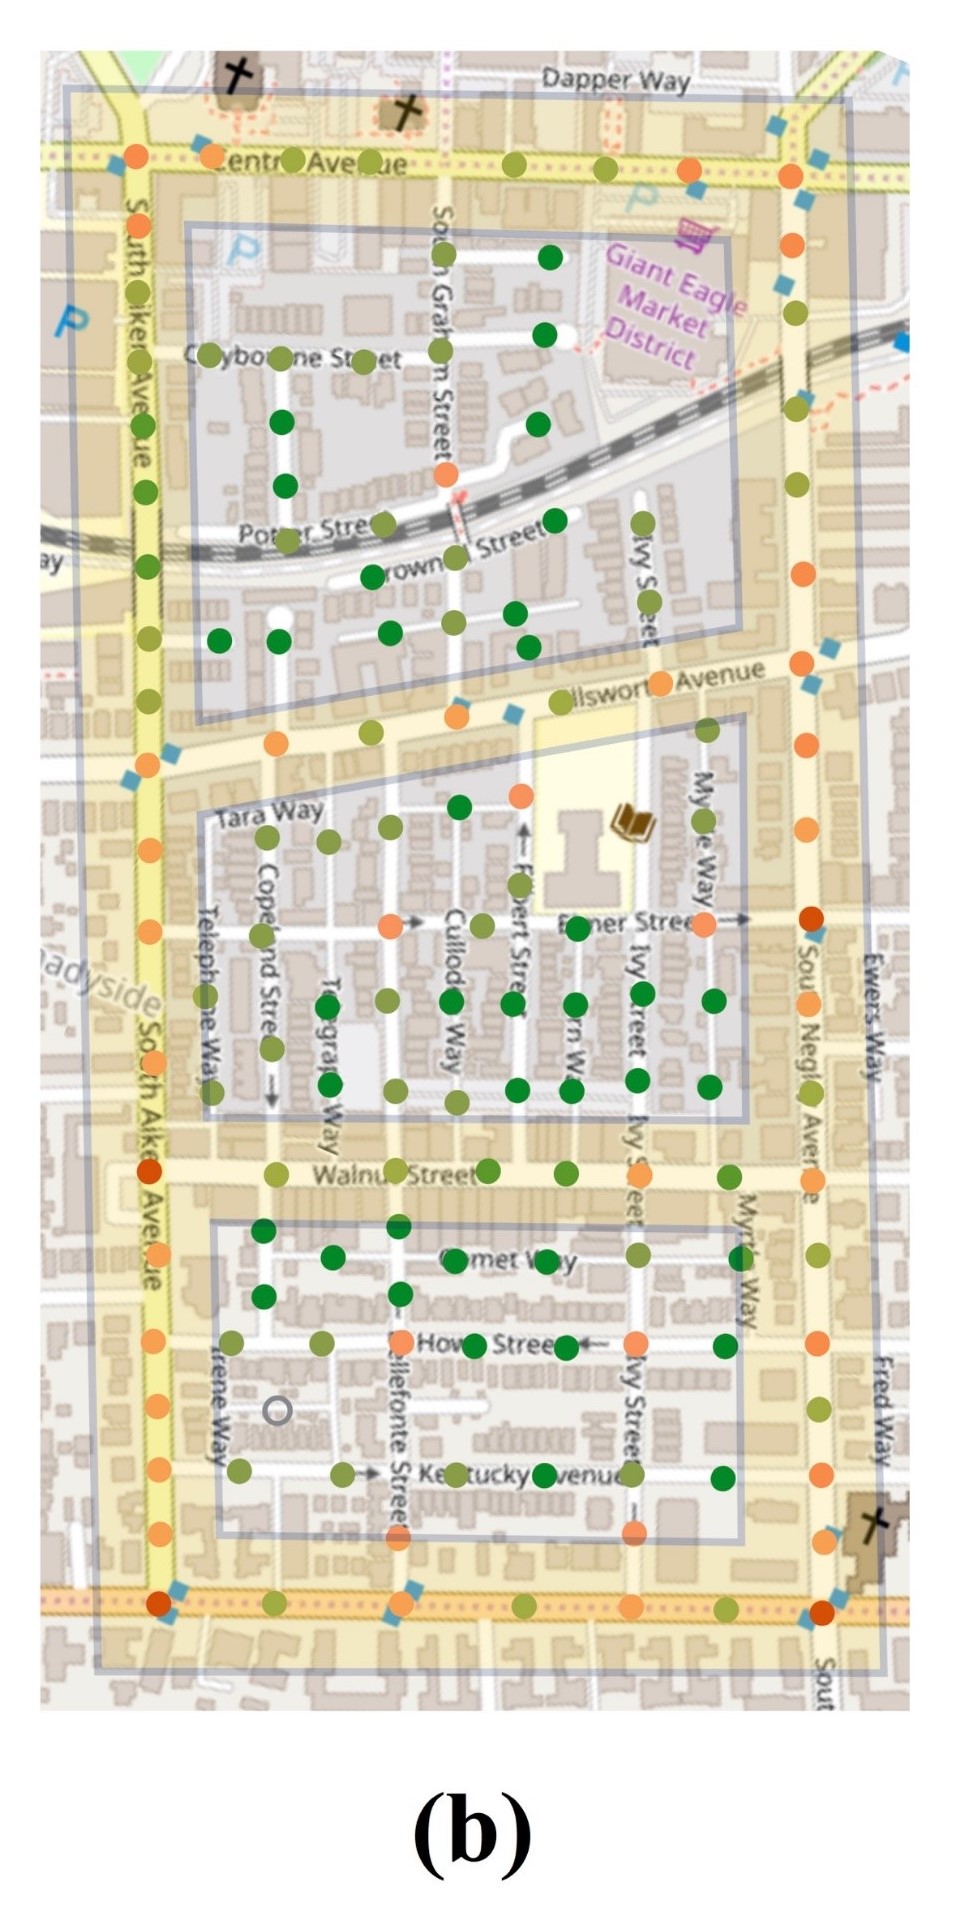
For example, focusing on the area shown in map (a), we want to increase its overall biking safety, but the local government has a budget constraint. By installing bike lanes to the non-local streets of the area (map (b)), will increase the biking safety by 26% according to our model.
Of course, an important aspect missing from this study is the people’s perception of safety, which can certainly be different from the actual safety scores obtained from hard data and models. Incorporating these elements in decision making from local authorities is crucial for achieving their final objective of sustainable transportation.
You can learn more about our work in the space at: https://pittsmartliving.org/
Comments