![]() We are happy to announce the publication of the
We are happy to announce the publication of the
Highlights from the 1st IEEE Symposium on Biological Data Visualization (BioVis
2011, https://www.biovis.net/2011/index.html) in BMC
Bioinformatics.
The BioVis 2011 Highlights are a collection of papers
addressing important visualization and exploration challenges in the areas of
sequence alignments, metabolomics, biochemical simulations and screens,
networks, pedigrees and expression quantitative trait loci (eQTL). By making
these highlights available in the open-access BMC Bioinformatics journal, we
hope to foster the knowledge transfer between the bioinformatics, biology and
visualization communities.
 Heinrich et al. describe the interactive Hierarchical
Aggregation Table (iHAT), which facilitates the visualization of multiple
sequence alignments, associated metadata, and hierarchical clusterings. Smith
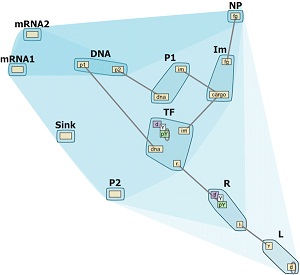
et al. present RuleBender, a novel visualization system for the integrated
visualization, modeling and simulation of rule-based intracellular
biochemistry. In the same spirit, Strobelt et al. present HiTSEE
(High-Throughput Screening Exploration Environment), a visualization tool for
the analysis of large chemical screens used to examine biochemical
processes. Paterson et al. describe
VIPER (Visual Pedigree Explorer), a software tool for pedigree genotype
visualization that integrates an inheritance-checking algorithm with a novel
space-efficient pedigree visualization. Livengood et al. present a system that enables interactive
comparative visualization and analytics of metabolomics data obtained by
two-dimensional gas chromatography-mass spectrometry. Mayerich et al. introduce
NetMets, a method for quantifying and visualizing errors in biological network
segmentation. Finally, Bartlett et al. present and discuss the eQTL biological
data visualization challenge conducted as the BioVis 2011 contest. This is a
tremendously important biological grand challenge domain with no extant
solutions. The authors provide a thought-provoking perspective on the complex
relations between the biology, bioinformatics, and visualization domains. They
discuss the contest entries submitted to BioVis 2011, present the lessons learned,
and conclude with open questions for the future.
Given the growing need for visualization tools to gain
insight into large and complex data sets that are becoming increasingly common
in biology, the papers included in this collection will be relevant to
scientists in bioinformatics, biology and data visualization.
If data visualization is relevant to your work, you
should plan to attend BioVis 2012. The symposium will be taking place on
October 14-15 in Seattle, WA and is co-located with the IEEE VisWeek meeting.
Poster and contest submissions will be accepted until 27 June 2012. BioVis is
an interdisciplinary event and we strongly encourage the participation of
experts in bioinformatics, biology and data visualization to establish an
ongoing dialog between these communities.
BioVis is sponsored by the IEEE Technical Committee on
Visualization and Computer Graphics and affiliated with the International
Society for Computational Biology (ISCB), the ACM SIG Bioinformatics as well as
the IEEE Technical Committee on Computational Life Sciences (TCCLS).
Significant registration discounts are offered to members of those societies.
Nils Gehlenborg

Comments