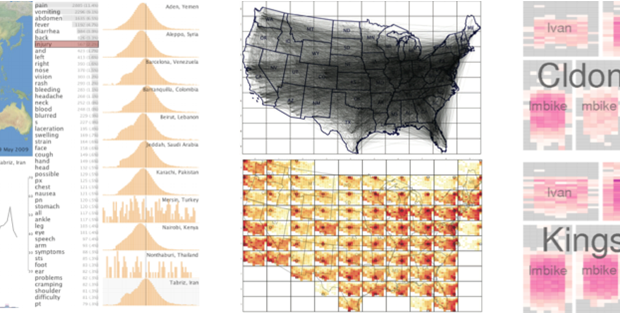
My background is in computer science – with a focus on visualization, visual analytics, and computer graphics. How do these areas link to movement ecology?
I learned the connection between these fields from the COST Action IC0903 MOVE on “Knowledge Discovery from Moving Objects”. COST (European Cooperation in Science and Technology) supports networking between researchers across Europe through so-called “Actions”. A COST Action is a networking instrument for science and technology that supports collaboration by, for example, providing support for interdisciplinary meetings, exchange of junior researchers between research groups, workshops, conferences, or summer schools.
COST MOVE is an Action that was active between 2009 and 2013. It built a collaboration network that advanced knowledge extraction methods for large amounts of data of moving objects, led by Robert Weibel. It was a truly interdisciplinary network, bringing together experts from different subfields of geographic information science and computer science with domain experts from transportation, courier services, epidemiology, ecology, and others.
I found this combination of basic research (on methods development) with interesting applications very inspiring. In particular, before COST MOVE, I hadn’t been aware of the highly interesting research problems from applications in movement ecology, and how visual analytics could link to these problems.
Visual analytics, in general, aims to support us in gaining insight into large and complex data by combining the mutual strengths of automatic data analysis and interactive visual exploration by the analyst. Therefore, visual analytics is interdisciplinary by nature, including fields like data mining, statistics, machine learning, visualization, human-computer interaction, and cognitive science.
Visual analytics, in general, aims to support us in gaining insight into large and complex data by combining the mutual strengths of automatic data analysis and interactive visual exploration by the analyst.
Visual analytics is a rather new research field – about ten years old. Its relevance has been largely increasing over the years with the increasing demand for advanced data analysis methods. The analysis of moving objects is an especially good example of where we want to combine machine and human analysis because the data is often complex and it has a natural spatial embedding (e.g. on a geographic map) that can be easily understood by the human analyst.
In COST MOVE, the link between moving objects and visual analytics was covered in one of four working groups: the working group on “Visual Analytics of Movement and Cognitive Issues”, led by Urška Demšar (School of Geography & Geosciences, University of St Andrews) and myself. Like COST MOVE as a whole, our working group brought together experts for basic research on analysis methods and domain experts.
Our working group successfully devised new visualization techniques for domain-specific data, adapted and integrated machine-based analysis techniques from spatial data mining, computational geometry, and geographic information science for domain-oriented analysis tasks. By collaborating with experts from application fields, we were able to adapt the interaction techniques to their needs, benefiting their research. In return, methods researchers, including myself, benefited from highly interesting, practical analysis problems and realistic data.
By collaborating with experts from application fields, we were able to adapt the interaction techniques to their needs, benefiting their research. In return, methods researchers, including myself, benefited from highly interesting, practical analysis problems and realistic data.
Movement ecology was represented by a large group of domain experts within COST MOVE. Their data analysis problems are exemplary for visual analytics: Data is typically collected by sensors like GPS attached to animals in order to collect information about movement behavior within the animal’s habitat. Such data is difficult to handle because it may come with varying sampling frequency, missing data, noise, and other aspects.
Furthermore, we have to deal with complex data spaces because the trajectories are not just paths on a 2-D geographic map but have additional attributes like sensor information from accelerometers. Therefore, movement ecology is an ideal application area and test case for visual analytics.
As a visual analytics and visualization researcher, I’ve benefited a lot from working in the interdisciplinary setup of COST MOVE. I’ve learned a variety of analytics methods and domain-oriented research questions, which helped me broaden my perspective on visual analytics. In return, I think that visual analytics can serve as an advanced approach to complex data analysis problems in various application domains, including movement ecology.
Daniel Weiskopf
Latest posts by Daniel Weiskopf (see all)
- Visual Analytics for Movement Ecology - 13th March 2015
Comments