The incidence of Lyme disease, caused by tick-borne Borrelia burgdorferi bacteria, has now reached epidemic proportions in the US. There are an estimated 400,000 cases per year, with numbers rising due to climate change and habitat expansion of the tick vector. Early symptoms include skin rash, fever, and joint pain. With timely diagnosis and antibiotic treatment, most patients recover.
However, treatment fails in at least 10-20% of patients, who develop persistent symptoms including chronic pain, cognitive dysfunction, and debilitating fatigue. This is known as post-treatment Lyme disease (PTLD). These symptoms are often severe, frequently leading to profound personal, educational, and monetary losses.
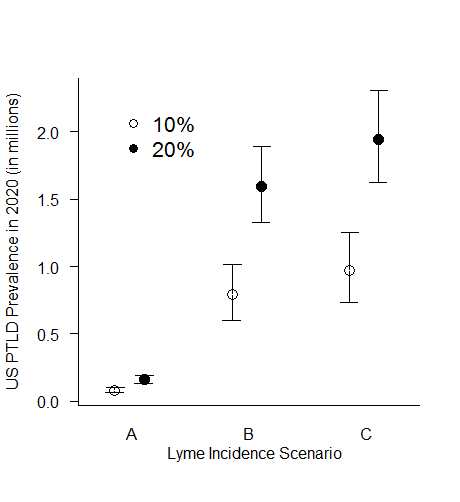
Using six sets of assumptions we estimate that by 2020 there will be between 81,713 to 1,944,189 individuals with PTLD in the US.
Until now, estimates of the number of people in the US living with PTLD were not available. This manuscript provides the framework for a mathematical modeling technique that can be used to estimate the prevalence of PTLD in the US. We apply our technique to three incidence scenarios and two failure rates to estimate the cumulative prevalence of PTLD in the years 2016 and 2020.
Using six sets of assumptions we estimate that by 2020 there will be between 81,713 to 1,944,189 individuals with PTLD in the US. The 95% confidence intervals suggest that incident rates could even reach as high as 2.3 million cases. All results indicate the prevalence of PTLD is rising over time. The approach we present provides a framework for updating prevalence estimates in future years and when more precise input data become available.
Our PTLD estimates are calculated using mathematical modeling and simulation, counting survivors of cases originating from 1980 until two index dates, 2016 and 2020. This framework incorporates multiple data types from several sources. We first propose three possible trajectories for the annual incidence of Lyme disease, and model the growth of the epidemic during the years the disease has been documented in the US. These trajectories were based on previously published information about Lyme disease incidence rates, originating from two sources.
One source was based on public health surveillance, when medical clinicians report Lyme disease cases to local and state health authorities. This method estimated 34,449 cases per year by 2005. The second source was obtained by US CDC epidemiologists and was based on studies of either Lyme disease testing lab results or health insurance claims. These sources calculated more than 300,000 incident cases per year by 2005.
The disparity between these two numbers indicates vast under-reporting by health authorities, is consistent with community-based reports that suggest large numbers of cases, and exemplifies shortfalls in the current Lyme disease knowledge base. It is possible that actual incidence rates are much higher.
Based on these two figures of annual incidence, we modeled three scenarios of growth of the Lyme disease epidemic: linear growth from 0 cases in 1980 to 34,449 by 2005, then remaining stable at 34,449 thereafter (Scenario A in Figure 1); linear growth from 0 cases in 1980 to 329,000 by 2005, then remaining stable at 329,000 thereafter (Scenario B); or linear growth from 0 cases in 1980 to 329,000 by 2005 and continued linear growth onward (Scenario C).

The second important input measure in calculating cumulative PTLD cases was a treatment failure rate, which has been estimated at up to 40% of cases in some studies. We chose to more narrowly define this as either 10% or 20%. These two failure rates, combined with three incidence scenarios, resulted in six mathematical simulations.
All simulations accounted for age and gender distributions of Lyme disease diagnosis, as well as life expectancy. For example, if a five-year-old girl diagnosed in 1983 with Lyme disease was among the 10-20% with PTLD, she might still be alive and counted in 2020. However, a 55-year old man diagnosed at the same time might not be.
Our prevalence estimates reveal there are likely millions of people struggling with chronic illness and disability due to the effects of Lyme disease. In addition, they and their families are impacted financially, because they are often unable to work or complete educations, and are forced to bear the medical costs themselves.
Treating acute Lyme disease alone has been estimated to cost over $1 billion per year in the US. The costs of treating this chronic disease have not been determined, but are expected to be high. Our study is a first step toward more understanding of the burden of PTLD, and reinforces the need for greatly expanding research that will lead to better treatment of these patients.
Comments