For almost thirty years, David Stern has been obsessed with the fact that male fruit flies ‘sing’ to females. His work on this problem, published today in BMC Biology, has got him thinking about reproducibility in science. In this guest post, he sets out his prescription to help scientists check whether research results are reliable

As an undergraduate at Cornell in 1985, I looked for a research problem that combined my interests in genetics, evolution, and behavior. Kyriacou and Hall had recently reported that the period gene, which regulates circadian rhythms, also controlled a rhythm of fruit fly courtship song and that evolution of period explained a species difference in this courtship song rhythm. This seemed a promising avenue, so I surveyed molecular variation at the period locus in Drosophila species, hoping to correlate this genetic variation with variation in the song rhythm.
I hand-scored the fly songs, attempting to find the song rhythms. I couldn’t find them. I figured “Heck. I’m an undergraduate. I don’t have much data. I probably screwed up.”
I let the problem rest. About six years ago, though, I decided to try again. We built a device for collecting courtship song and wrote software to score the songs automatically. We looked for the rhythms, but we couldn’t find them.
This observation kept nagging at me, however. So, I set out to reproduce Kyriacou and Hall’s experiment as closely as possible. Still, I couldn’t find the rhythms. Finally, when I analysed the data precisely as Kyriacou and Hall had—binning the time series data and scoring only the strongest periodic signal, patterns similar to the rhythms popped out of this analysis. however, almost none of the signals I found reached any sensible level of statistical significance. While I was able to “replicate” Kyriacou and Hall’s song rhythms, they were artefacts of data binning and did not result from a real biological phenomenon.
Recently in the scientific press, there has been considerable discussion of scientific fraud and of research findings that cannot be replicated. While outright fraud is probably rare, a much more widespread problem is the publication of results which, like those of Kyriacou and Hall, were got at through honest scientific investigation but that cannot be replicated.
How can we minimize publication of results that are not reproducible? I have one simple prescription.
Authors should show their data.
Often, authors present only summary statistics, like the mean and some estimate of the variability. Instead, they should show the data from which these statistics were derived. Presentation of the data themselves often is enough to allow readers to determine whether a result is compelling.
At an ignominious extreme, variation often is represented by the standard error of the mean (or its evil cousin, the 95% confidence interval). The mind must perform cartwheels to reconstruct original data from the standard error. But the real problem is that the standard error is not an intuitive representation of the variability in the original data; it reflects both the variation and the sample size.
The widespread use of the standard error is deeply troubling. It cloaks the data in a veil of scientific certainty that is never warranted. I have heard students say, “But the standard error makes the result look cleaner than the standard deviation.” I fear that many of my colleagues think along the same lines.
The sad fact is that many scientific figures (bar charts, box plots, etc.) are obsolete tools invented by scientists prior to the widespread availability of computers. As far as I can tell, they are still used simply because this is how most of us were taught to present data. Computers provide wonderful ways of presenting data unsummarized, which provides readers with the opportunity to interact with the data and—this is the important part—to come to their own conclusions.
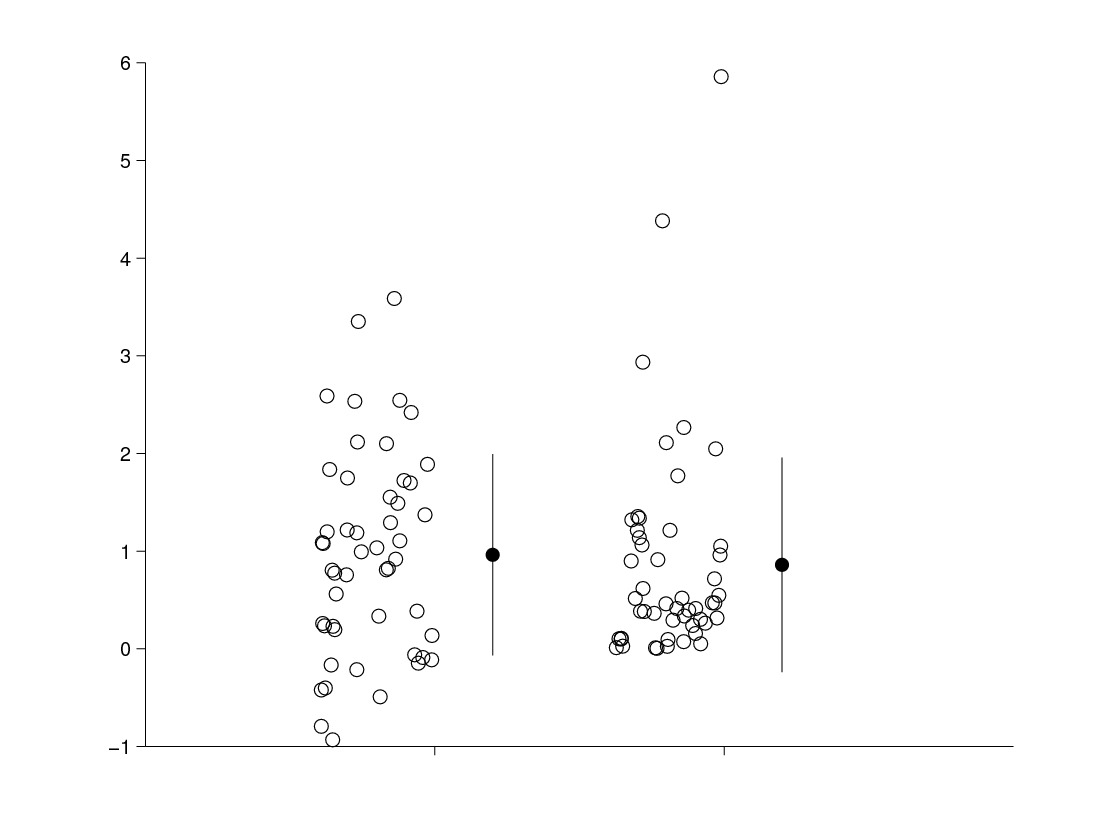
Summary statistics are useful, of course, when they are used as a guide to interpreting the data, rather than as a stand-in for the data. My preferred technique is to show the data in a jitter-plot alongside some simple summary statistics, such as the mean and the standard deviation. Such plots often lead to more cautious interpretation of results than does blind applications of statistical tests. They also prevent the concealment of interesting data distributions. The chart on the left demonstrates how different data distributions can produce similar summary statistics. Random samples were taken from a normal distribution and a gamma distribution. The summary statistics are similar for the two samples, but the jitter plot clearly demonstrates the differences between the samples.
This simple prescription may generate more healthy scepticism about scientific results and, therefore, reduced publication of science that cannot be replicated.
In an effort to increase transparency and reproducibility in science, journal editors have been pushing authors to make raw data and analytical tools available to readers. I doubt that this will have much impact. Few individuals make the effort to download and reanalyze previously published data, because there is no scientific glory in replicating (or in failing to replicate) prior work. But everyone benefits when data are presented fully in plots that allow readers to decide for themselves whether the results deserve further consideration. Journal editors are in the best position to enforce such standards, and they owe it to science to do so.
Acknowledgements
Many thanks to Bronwyn Duffy and Sean Eddy for helpful discussions about this post.
Latest posts by Guest (see all)
- Microbial forensics: It’s not just fingerprints that can be left behind - 12th May 2015
- How can ‘conservation genomics’ help the recovery of the most endangered species? - 12th December 2014
- Acetate helps hypoxic cancer cells get fat - 11th December 2014
[…] Can you show us that again please? For almost thirty years, David Stern has been obsessed with the fact that male fruit flies ‘sing’ to females. […]
There’s another reason for data-sharing, which is that it improves accuracy, because people will check everything more carefully if they know it will be public. It can be scary but is important I think; I described my experiences with finding error in my own data here https://deevybee.blogspot.co.uk/2014/05/data-sharing-exciting-but-scary.html
Nice post! I agree with Dorothy in the comments that another benefit to reviewing data before sharing is that it improves accuracy. As a data repository, we offer that as a service to our researchers. I have argued that data repositories – not just journals – also have a role in reviewing data & code pre-publication (https://isps.yale.edu/news/blog/2013/07/the-role-of-data-repositories-in-reproducible-research). It should be a community effort!
[…] the BioMed Central blog, David Stern describes his unsuccessful efforts to replicate a published effect and the realisation that it was an […]