Trade is an integral part of the cattle industry in Ireland. It is driven by seasonal supply and demand relating to farm enterprise type and market prices. More than half of this trade is through markets, the remainder being direct farm-to-farm sales, some of which are now mediated through online dealers.
All movements of cattle in Ireland are recorded by the Department of Agriculture, Food and the Marine and are represented in publicly available annual summary statistics. Whilst these reports present national breakdown summaries of all movements, they don’t convey the spatiotemporal patterns and localised intensities of the actual movements.
Why does movement matter?
Purchasing cattle increases the risk of introducing disease to farms. Even following best practice advice, purchasing cattle from markets or directly from other farms, comes with an inherent risk of the potential introduction of pathogens.
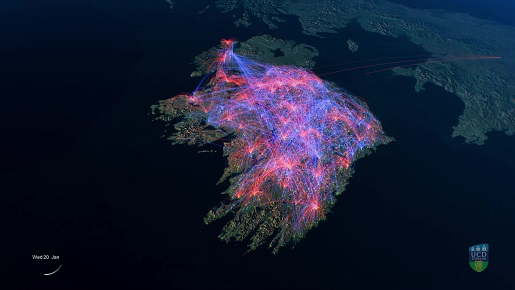
To highlight the volume and type of cattle movement occurring in Ireland over the course of a calendar year, we generated an animation for the year 2016: https://youtu.be/PTCdPMnenBw (best viewed at 1080p and full screen).
The animation splits movements into two types; low risk and high risk. Low risk movements, blue in the animation, are a ‘biosecurity checkout’ whereby cattle have no more interactions with other cattle in Ireland at the end of the movement, either because they go to slaughter or because they are exported. High risk movements, red in the animation, are where cattle are moved from farm to farm, either directly or via markets.
Imports from abroad onto farms are also displayed as high risk, originating from the geographic centre of the country of origin in the animation. The convergence of red lines represents market days. The movement lines fade after approximately 5 days, real-time, thereby displaying weekly cycles commonplace in many of the markets. The convergence of blue lines represents abattoirs and export holding centres.
The total distance of movements travelled by all individual cattle in Ireland in 2016 was 283 million kilometres, which is equivalent to the distance to the sun and back.
The 1.3 million movement events shown in the video, representing all journeys travelled by vehicles, such as trailers, to transport cattle to markets, new herds, slaughter plants or export facilities in 2016, cover a cumulative distance of 46 million kilometres. That is the equivalent of circumnavigating the Earth 1,015 times or travelling to the moon and back 60 times.
This animation was created as a once-off exercise to raise awareness in the farming and veterinary communities to the scale of cattle movements, in particular, higher risk movements, in Ireland. While cattle trading will always be an essential component of farming, the risk of purchasing in disease could be mitigated against by reducing the number of purchase events.
Guy McGrath
Latest posts by Guy McGrath (see all)
- Visualising cattle movement in Ireland - 1st October 2018
Comments