
Critics argue that although they are merely representative of the overall academic reputation of a journal, impact factors are damaging the scholarly system and can often lead to questionable practices amongst researchers. That said, the impact factor seems to have become such an ingrained part of scholarly work that any attempts to limit its popularity and use as a proxy for quality and impact face many challenges.
Despite this, the limitations of such a measure have not gone unnoticed. Funders and institutions (particularly in the US, UK, Europe, and Australia) are increasingly looking and actively asking for other indicators of impact, as well as a more evidence-based representation of the broader dissemination, reuse and application of academic work.
One of the many limitations of the impact factor is that it represents the reception of the work only amongst the academic community; providing no insight into how the work is received by a broader audience.
With more and more scholarly content now published under an open access model, free to anyone who cares to read it, the way that the general public consumes and interacts with academic research is changing.
Measuring the ‘impact’, whether it is among the general public, future research, or via practical application of outcomes, is proving difficult.
Citation counts are slow to accrue; it can take months, or sometimes years, for a research article to be cited just a handful of times. They also offer little in terms of reflecting the credit that researchers are due for other outputs of their work – this becomes particularly apparent in disciplines such as the humanities, where the preferred form of research publication is not necessarily a journal article.
At the same time, there has been a huge shift in scholarly communication towards online communities and platforms. Conference presentations are now accompanied by a running Twitter commentary, and a wide variety of bloggers regularly feature and highlight research of interest.
What is impact?
Exactly what impact is (or is not) has become a hot topic in recent years. The 2014 REF evaluation of UK higher education institutions required a significant proportion of time and effort be spent on submitting Impact Case Studies – which made up a large percentage of the final ranking of an institution.
Measuring this ‘impact’, whether it is among the general public, future research, or via practical application of outcomes, is proving difficult.
Metrics do have a role to play in this space, although they are clearly not the complete answer. In the initial stages of gathering such evidence metrics can be applied to provide a useful indicator of potential impact; if an article is cited a lot, receives a lot of news attention (for positive reasons), or causes a stir amongst online networks, chances are that somewhere along the way it is going to have some form of broader impact.
Monitoring online attention
Tracking and collating this online attention for individual research outputs offers many potential benefits.
Authors and editors can gain a much better understanding of where their work is being talked about and get credit for work that is not published in journal article format. They can also respond to online commentary, manage their digital identity, and report on this attention as evidence of broader dissemination in funding or job applications.
These measures of attention and online engagement have come to be known as ‘altmetrics’ (or alternative metrics) – a term first coined in 2010. They are intended to sit alongside, and be complementary to, more traditional measures of reach such as the impact factor and download counts.
Using such combined metrics can help to give a more complete picture of the online activity surrounding a specific research output. Key to their premise is the idea that the value lies not in the number of shares, or tweets, or news mentions, but in actually seeing what people are saying about the research, and how they are interpreting it.
Altmetrics in practice
Over the last few years the range of altmetrics data and tools has grown rapidly. At Altmetric, we’ve taken the approach of putting our focus on quantitative, fully auditable data that can really help users understand how a piece of research has been received and interpreted, rather than just seeing a count of people who have referenced or shared it.
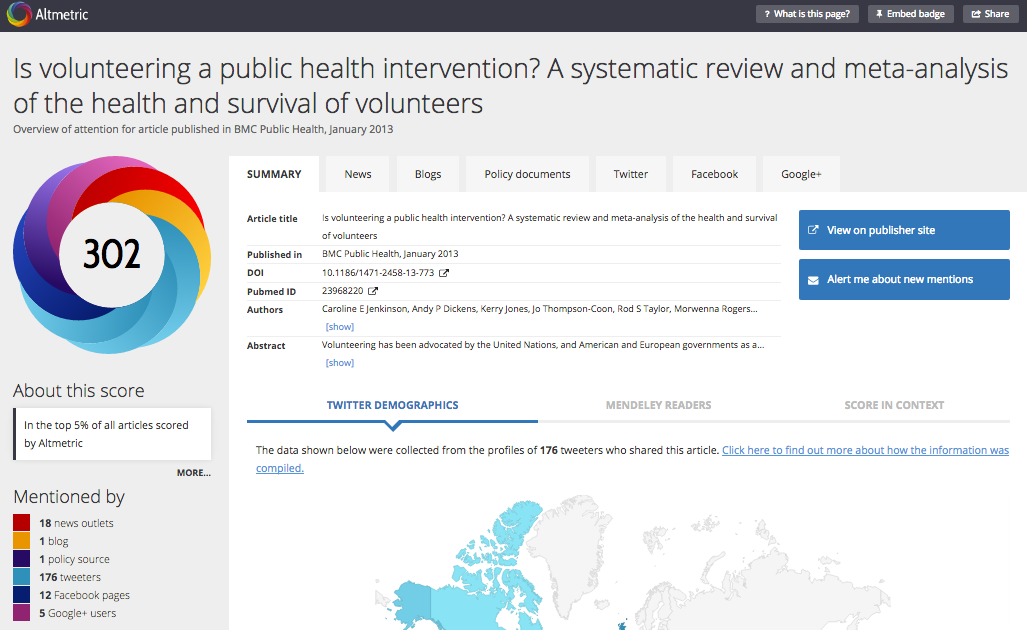
For each research output we find a mention of in one of the sources we track, we create what’s known as a ‘details page’. This details page for an article is accessible via the donut visualization on a publisher article page (as is the case for BioMed Central articles), or using the free Altmetric Bookmarklet. It displays the collated original mentions from each source tracked by Altmetric, as well as mapping and categorizing the demographics of Twitter and Mendeley readers who have shared the research amongst their networks.
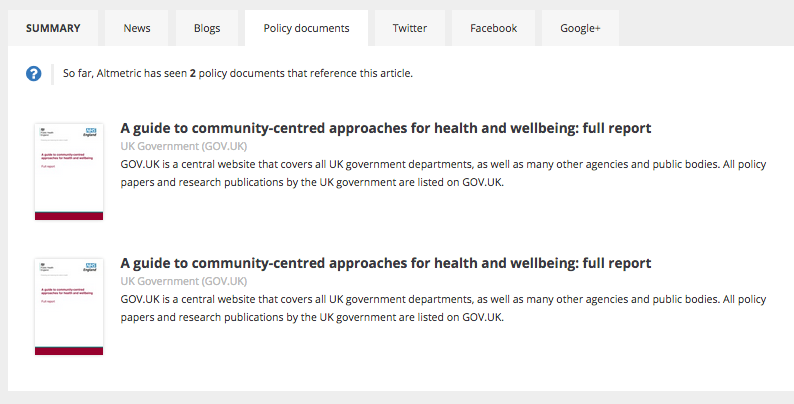
Particularly of interest to those keen to demonstrate the academic impact of their work will be the mentions that Altmetric gathers from a curated list of policy documents – offering an easy way for researchers to get a collated record of where their work has had an influence on public policy.
Each research output we find a mention of is also assigned an Altmetric score – this is not intended to be a measure of the quality of the research or the author, but rather an indicator of the type and volume of (positive and negative) attention the research has received. You can find out more about how the Altmetric score is calculated here. The score can be useful to identify at a glance which articles have had a lot of attention, and to compare levels of attention amongst other outputs published in the same field.
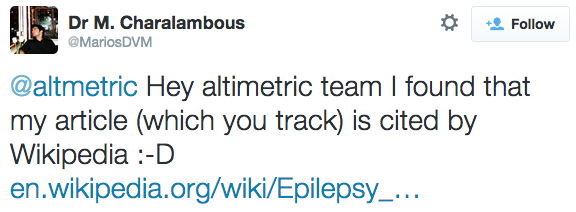
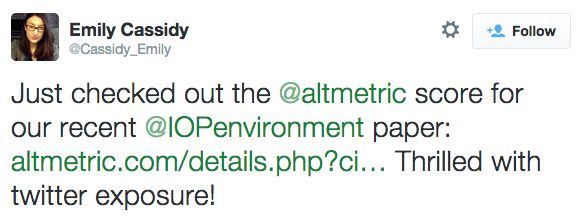
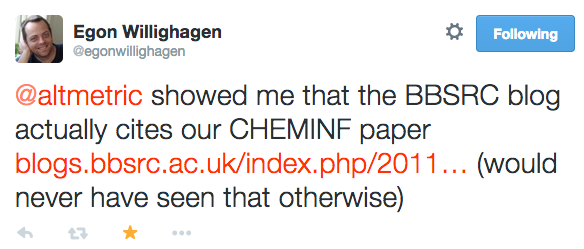
We’ve had some great feedback from researchers on how they’re using the data provided – for example some are including it in funding applications, others have embedded the donut visualizations in their online CVs, and others regularly refer to the metrics provided via their publisher for insight into the engagement and reach their article is achieving:
Publishers too are keen to embrace this new method of monitoring attention and activity around their publications. For example, BioMed Central Editors recently commented, “The Impact Factor isn’t really fair – it only gives an indicator of impact at the journal level. Altmetric is much better as it gives a better representation of the popularity of the article.” Others added that the data provided was “good for monitoring and helping shape the strategy for promotional activity, and to know who’s sharing.”
As these metrics and the evidence required by funders changes over time, it’s likely that the sources tracked and the way that authors in particular use this data will change. For now, we encourage you take a look at the Altmetric data for your articles or those published in your field – you never know what you might find!
A more comprehensive matric will replace impact factor, and “Almatric” is doing that. Impact factor’s influence on journals motivates publishers to cheat on the citation number, which is losing the original meaningfulness of this indicator.